Project Proposal
Zhuohui Liang(zl2974), Chufeng Yang(cy2588), Yiming Zhao(yz3955), Yu Liu(yl4604)
Risky Coffee? Or…Not?
Examing the risk of parking violation in different boroughs in NYC
Motivation
[Tweets]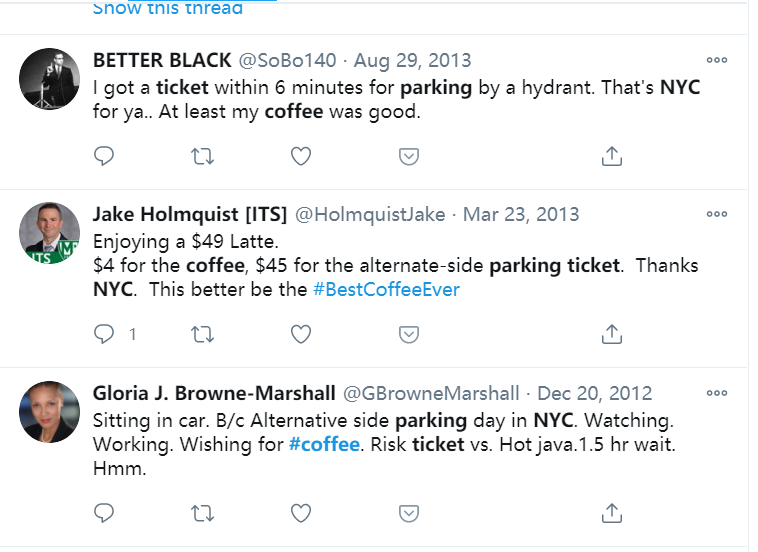
You temporarily parked in front of your office building to buy a cup of coffee in a side-walk cafe. A parking ticket warrior walked to your car, raised her scanner, and fired an invisible beam of light at your registration. She handed you a NYC parking ticket and that beam of light cost you $115.
According to statistics, New Yorkers drink 6.7 times the amount of coffee compared to average, and the average price consumers are paying for a cup of coffee is $2.99, but consider the above, do you think you really only paid a few bucks on your coffee?
Intended final product
A report regarding the distribution and relationship of cafe and parking violation, and a cool shiny app helps citizens to find the nearest location to have a cup of coffee without receiving a ticket.
Data source
Research questions
In this project, we are interested in using quantitative data to assess whether streets with cafes are easier to generate parking tickets and how much fine- amount are possibly associated with boroughs. We are also interested in the association between parking violations and time period during a day and different boroughs.
Analysis/Visualizations
We want to use Logistic regression to analyze association between Cafe and parking violations in different locations and time periods, and figuring out the real price of a cup of coffee. We expect to use plots (e.g. scatterplots, line plots) to demonstrate our results.Here’s our expected result:
- A line plot of trends in parking violations in NYC.
- A box plot of fine-amount in different boroughs.
- A scatterplot of cafe distribution in NYC.
- A map of Violation Counts.
- A map of Violation fine amounts.
Meanwhile, we hope to apply the analysis results on the map of NYC, showing our suggestions for NY citizens about parking and coffee consumption.
Anticipate Challenge
Although all data come from NYC open data, challenges can still emerge as they did not come from the same department and thus identity of the subjects, location name can vary.
Matching the violation location and coffee on to the map can be difficult, because all these information is marked by STREET, and we need to find the longitude and latitude information separately
The Shiny app we plan to develop has at least 2 paths of interaction, meaning we need at least 2 modules to produce A to B and B to A. It can be coding intensive and might only finish one module by the time of Due.
Timeline
date
work
Assignment due
44139
Determine project theme and data source
NA
11/5-11/7
Complete proposal
11/7, 1pm
11/7-11/8
Zoom meeting: draw a big picture on how to analysis data
NA
11/9-11/10
complete final source collection
NA
11/11-11/13
Zoom meeting: determine detailed devision of labour
NA
11/14-11/15
clean and tidy data
NA
11/16-11/17
Zoom meeting: draw a big picture of website design
NA
11/18-11/20
clean and tidy data
NA
11/21-11/27
make graphs and data analysis
NA
11/28-12/2
prepare paper work for report
NA
12/3-12/4
Complete report
12/5, 4pm
12/3-12/5
complete final webpage improvement and screencast
12/5, 4pm
Motivation
[Tweets]
You temporarily parked in front of your office building to buy a cup of coffee in a side-walk cafe. A parking ticket warrior walked to your car, raised her scanner, and fired an invisible beam of light at your registration. She handed you a NYC parking ticket and that beam of light cost you $115.
According to statistics, New Yorkers drink 6.7 times the amount of coffee compared to average, and the average price consumers are paying for a cup of coffee is $2.99, but consider the above, do you think you really only paid a few bucks on your coffee?
Intended final product
A report regarding the distribution and relationship of cafe and parking violation, and a cool shiny app helps citizens to find the nearest location to have a cup of coffee without receiving a ticket.
Data source
Research questions
In this project, we are interested in using quantitative data to assess whether streets with cafes are easier to generate parking tickets and how much fine- amount are possibly associated with boroughs. We are also interested in the association between parking violations and time period during a day and different boroughs.
Analysis/Visualizations
We want to use Logistic regression to analyze association between Cafe and parking violations in different locations and time periods, and figuring out the real price of a cup of coffee. We expect to use plots (e.g. scatterplots, line plots) to demonstrate our results.Here’s our expected result:
- A line plot of trends in parking violations in NYC.
- A box plot of fine-amount in different boroughs.
- A scatterplot of cafe distribution in NYC.
- A map of Violation Counts.
- A map of Violation fine amounts.
Meanwhile, we hope to apply the analysis results on the map of NYC, showing our suggestions for NY citizens about parking and coffee consumption.
Anticipate Challenge
Although all data come from NYC open data, challenges can still emerge as they did not come from the same department and thus identity of the subjects, location name can vary.
Matching the violation location and coffee on to the map can be difficult, because all these information is marked by STREET, and we need to find the longitude and latitude information separately
The Shiny app we plan to develop has at least 2 paths of interaction, meaning we need at least 2 modules to produce A to B and B to A. It can be coding intensive and might only finish one module by the time of Due.
Timeline
| date | work | Assignment due |
|---|---|---|
| 44139 | Determine project theme and data source | NA |
| 11/5-11/7 | Complete proposal | 11/7, 1pm |
| 11/7-11/8 | Zoom meeting: draw a big picture on how to analysis data | NA |
| 11/9-11/10 | complete final source collection | NA |
| 11/11-11/13 | Zoom meeting: determine detailed devision of labour | NA |
| 11/14-11/15 | clean and tidy data | NA |
| 11/16-11/17 | Zoom meeting: draw a big picture of website design | NA |
| 11/18-11/20 | clean and tidy data | NA |
| 11/21-11/27 | make graphs and data analysis | NA |
| 11/28-12/2 | prepare paper work for report | NA |
| 12/3-12/4 | Complete report | 12/5, 4pm |
| 12/3-12/5 | complete final webpage improvement and screencast | 12/5, 4pm |